
List analysis lets you work by exception so that, by applying the various filters, you can analyse those companies that require your attention according to the purpose of your analysis, instead of having to access company by company.
In this article, we explain the various sections of list analysis
- Header and task bar
- Summary
- Risk analysis
- Aggregate and average financial analysis
- List of companies
Bear in mind that the information shown in each case depends on the filters applied, so analysis is dynamic.
_______
Header and task bar
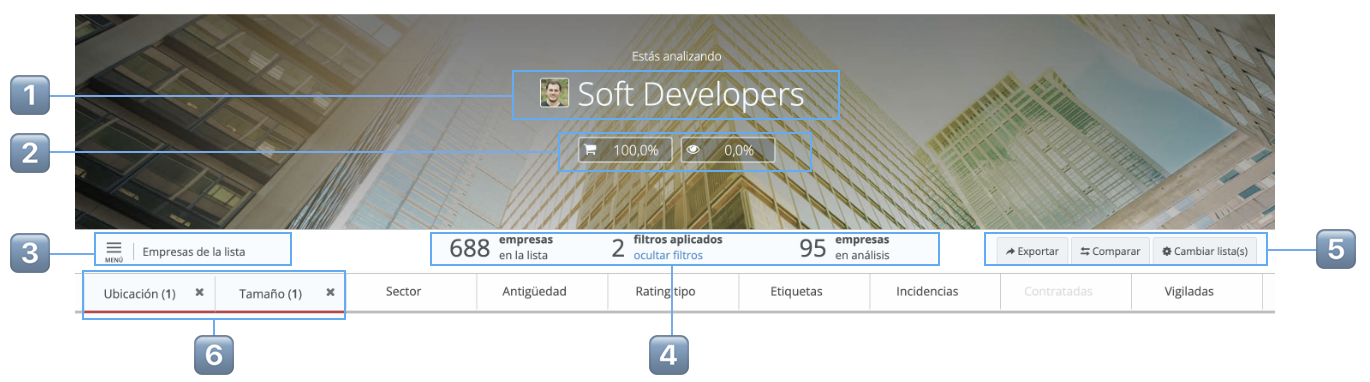
| 1️⃣ | Name of the list with the user avatar created |
| 2️⃣ | Percentage of Contracted and Followed companies. |
| 3️⃣ | Menu for the list and active section of analysis |
| 4️⃣ | Number of companies in the list, filters applied and number of companies being analysed after applying the filters. |
| 5️⃣ |
Tasks available: Export the list, add it to a comparison, change lists or add lists to the analysis |
| 6️⃣ | If you add any filter in the graph of any widget the filter bar is shown. Click to modify/remove each filter. |
_______
Summary
Section showing a summary of the main aggregate data for the companies on the list
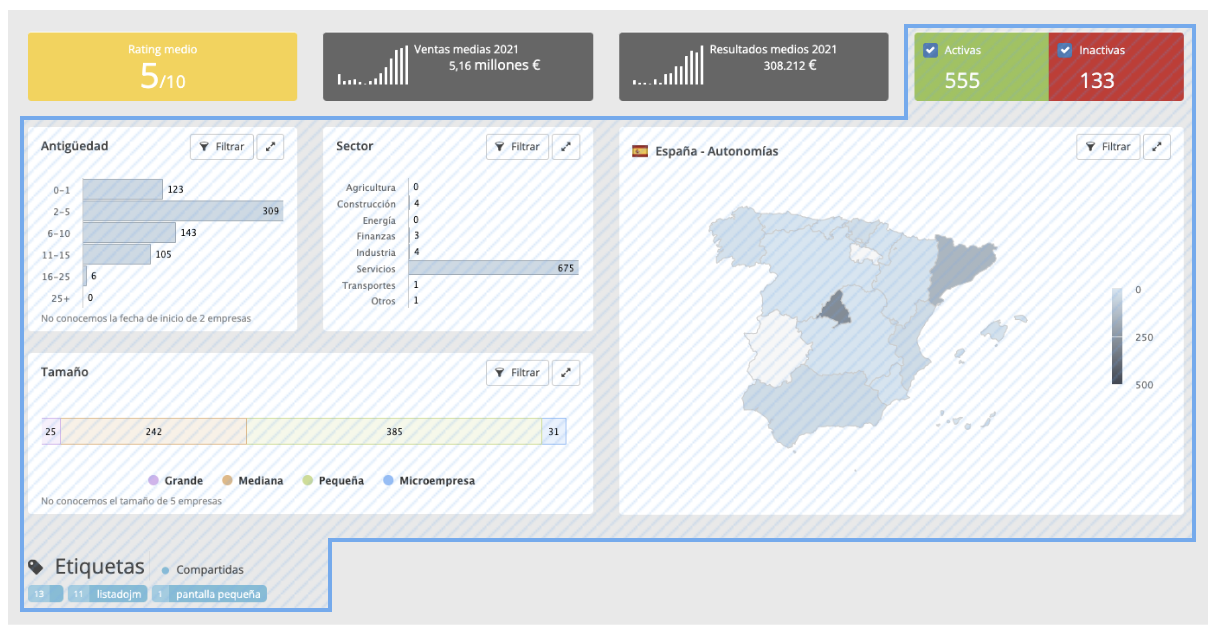
 |
Filterable graphs: Add filters by clicking on the desired values or using the filter button. For example, obtain active companies in Asturias that are less than 2 years old and are tagged New Customer. |
_______
Risk analysis
Section with widgets concerning companies’ valuation and payment according to various criterion (number of companies, its activity and its location)
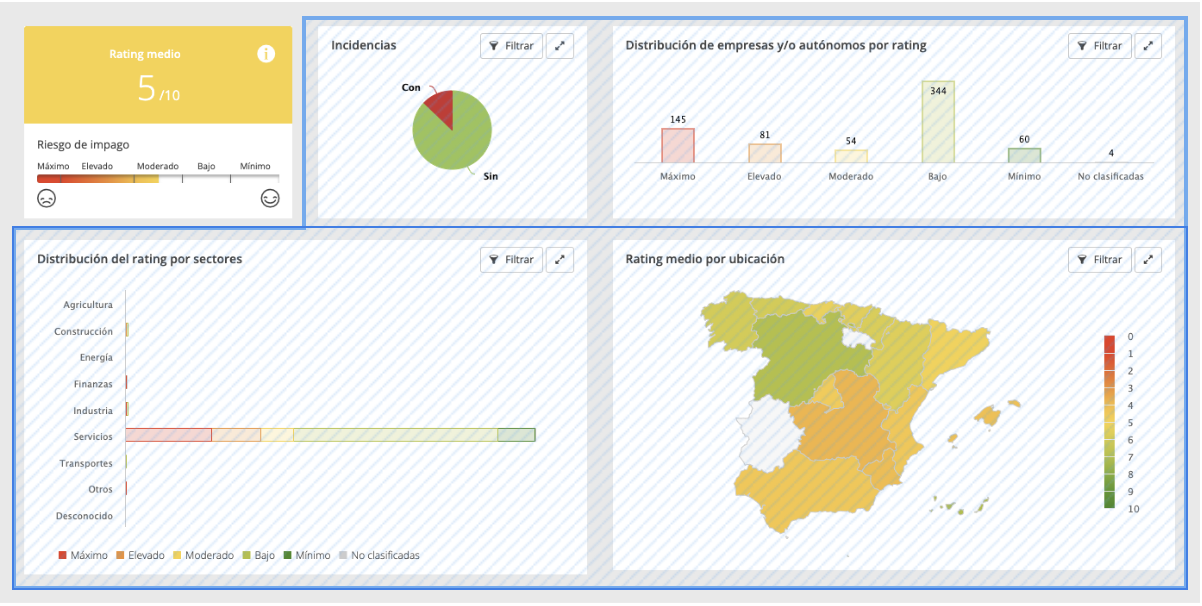
|
Filterable graphs: Add filters by clicking on the desired values or using the filter button. For example, obtain companies with payment incidents and maximum and high non-payment risk. When you apply the risk filter all the companies you do not have contracted disappear. |
_______
Aggregate and average financial analysis
Balance, account and analysis of the ratios of companies under analysis (considering the filters applied)
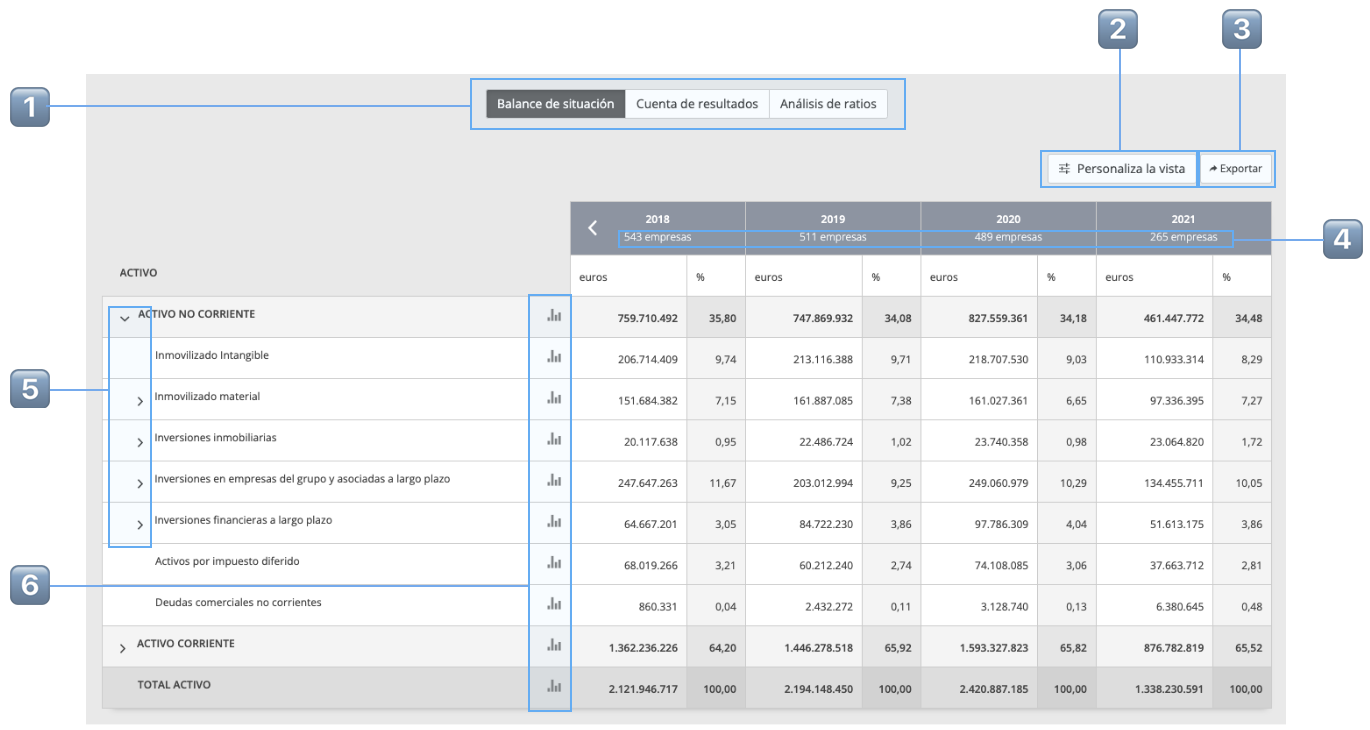
| 1️⃣ | Select which part of the analysis you would like to see |
| 2️⃣ | Customise the view to show average or absolute values, the unit, the type of percentage variation and the order of the financial years |
| 3️⃣ | Export the financial analysis to an Excel file. |
| 4️⃣ | Show the number of companies with financial data for each year |
| 5️⃣ |
Show or hide sub-heading items |
| 6️⃣ |
Consult an evolving graph and an explanation of the item |
_______
List of companies
Consult the companies under analysis according to the filters applied. There are two view options:
Record view:
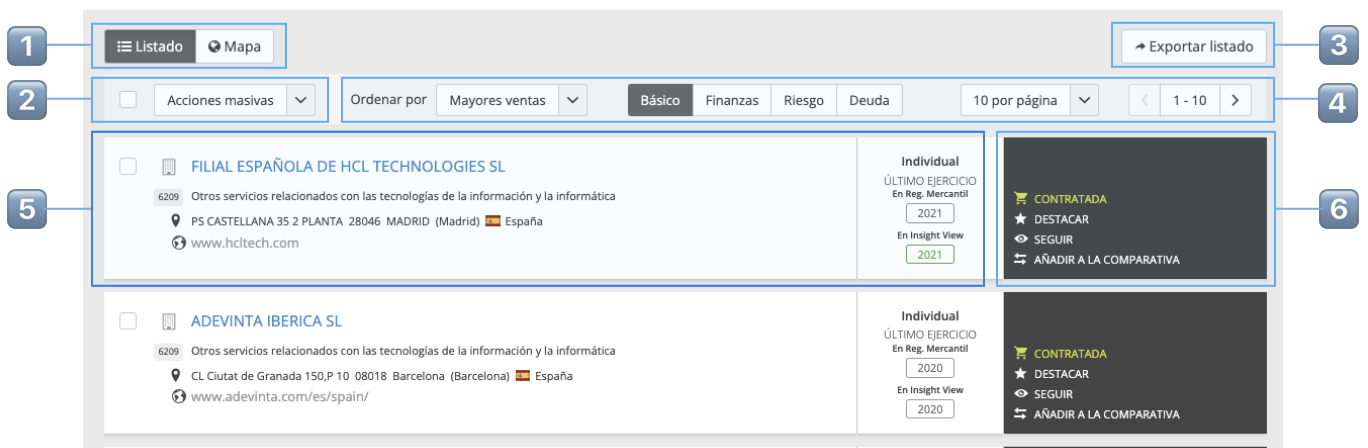
| 1️⃣ | Toggle between record view and map view |
| 2️⃣ | Massive action available for the selected companies on the record |
| 3️⃣ | Export record to Excel. In the emerging window, select which values you want to export. |
| 4️⃣ | Customisation of record view, order of companies and companies by page |
| 5️⃣ |
Information by companies according to the view selected in the record tool bar. |
| 6️⃣ |
Tasks available by company |
Map view
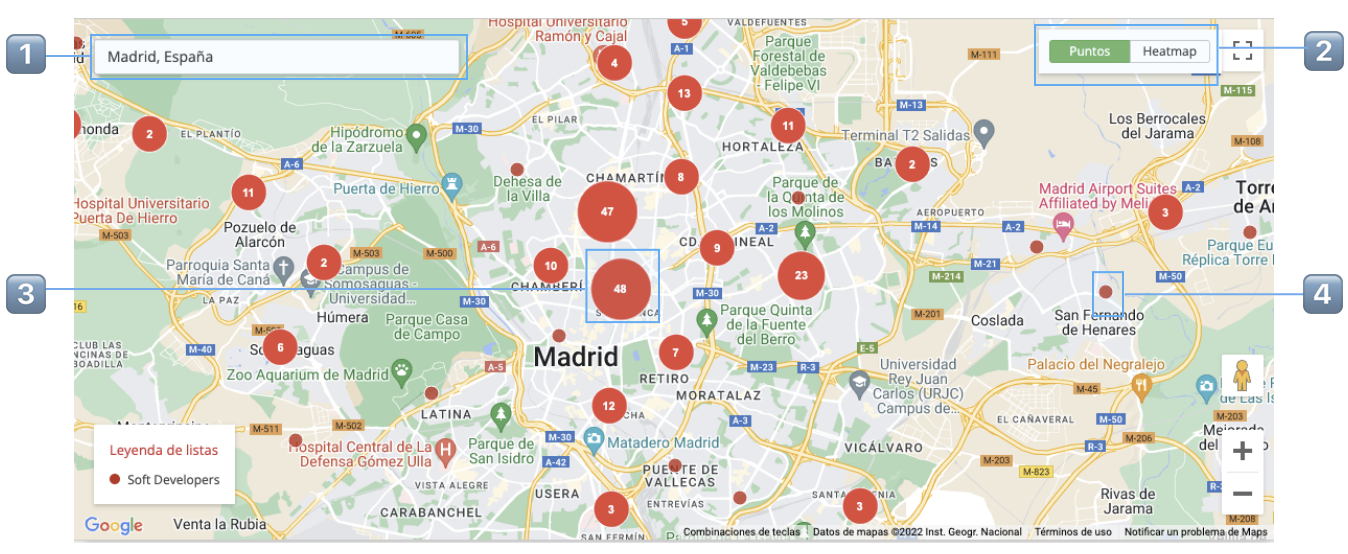
| 1️⃣ | Find a location to centre the map |
| 2️⃣ | Toggle between points/clusters view and heatmap view |
| 3️⃣ | Clusters group together several companies. Zoom in to reach the point |
| 4️⃣ | Click the point to open the company’s file |