
Comparative analysis places 5 items (companies or lists) in columns so you can analyse the strengths and weaknesses of each.
Since lists can be included in the comparison, you can, for example, create a list of the competitors of the compared companies to have the average data.
Once you have added two items to a comparison, you are ready to analyse them.
This article explains how to:
_______
Start comparison
We have already explained how to add items to a comparison and how they are added to the set-up widget, where as well as being able to add/remove items, you have a button to access the comparison.
- If it is not already open, open the comparison set-up widget
- Click Start comparison
⚠️You can add non-contracted companies to the comparison, but when you start comparing you must have contracted all the companies.
If one or more companies are not contracted, when you start the comparison you will be taken to the contracting menu.
Keep reading to find out what you are going to see in the comparative report.
_______
Comparison header and task bar
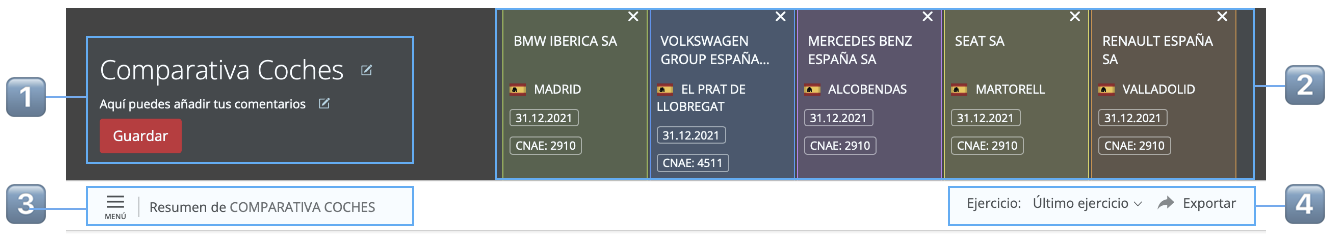
| 1️⃣ | Edit the comparison name, add a description if you like and save it so you can retrieve it any time. Comparisons are saved in the Reports section. |
| 2️⃣ |
Comparison items with the following information:
|
| 3️⃣ | Comparison menu and active section |
| 4️⃣ | Selection of the year for comparison and comparison export. |
_______
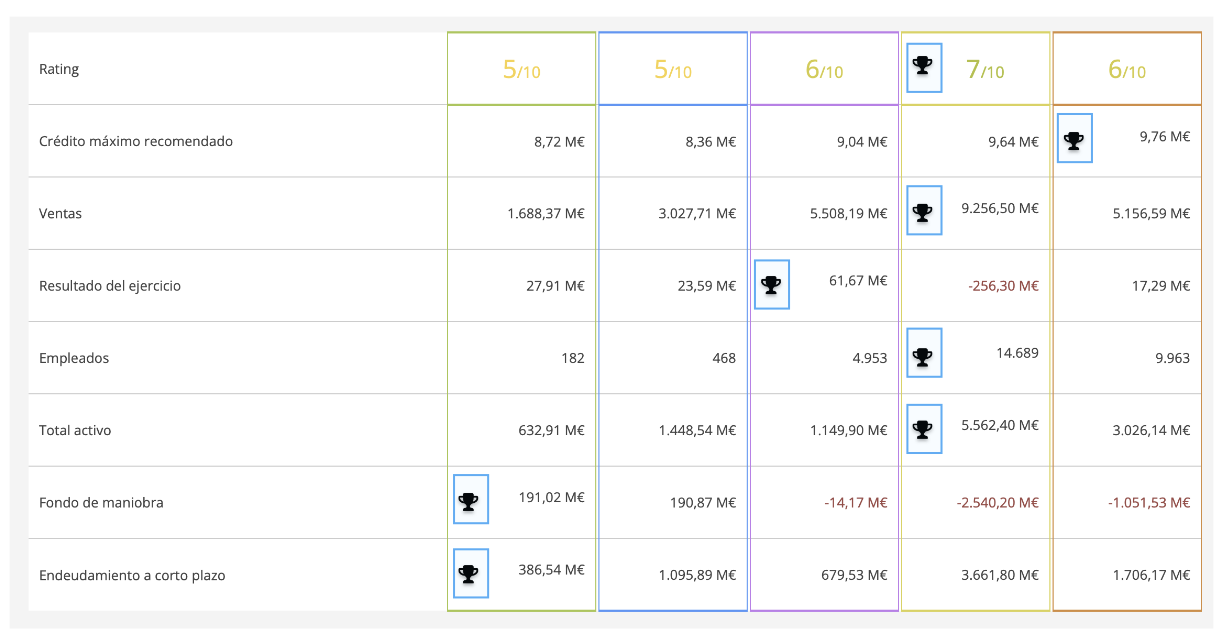
Summary of the comparison
The comparison summary shows what company or list has the highest rating, as shown in the image.
_______
Financial analysis of the comparison
Comparison of balance sheet, income statement and ratio analysis.
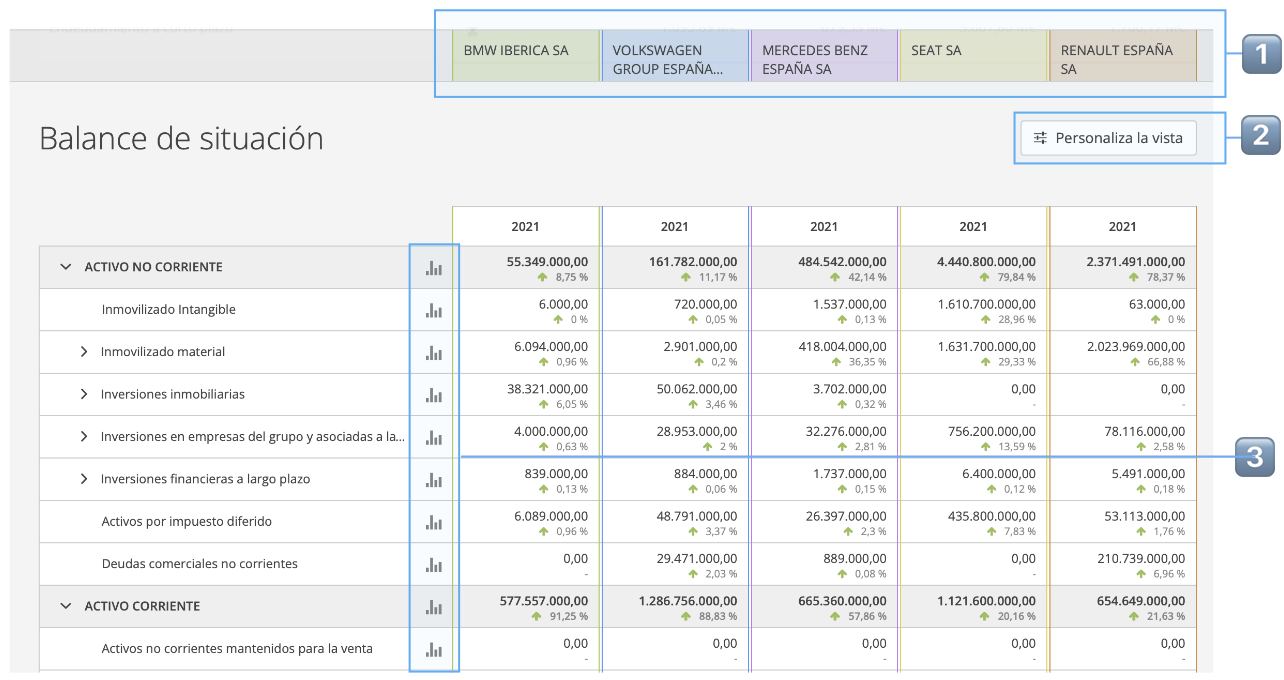
| 1️⃣ |
At all times the names of the comparison items are shown
|
| 2️⃣ |
Customise view to:
|
| 3️⃣ | Evolving graph and evolving table compared and an explanation of each item |